


Energy, Utilities and Sustainability Performance
The need for monitoring Utilities & Energy consumption and Sustainability Performance
Decarbonising operations and reaching carbon neutrality in the coming decade is no longer an option. Every organisation must act urgently to find ways to drastically reduce their Greenhouse Gas emissions. For most organisations, and particularly in Australia where most electricity is generated from coal, energy & utilities are a major source of CO2 emissions.
A key strategy to reducing emission (and cost) is to better understand and reduce consumption. But too often, utilities data is scattered in multiple places e.g. electricity, gas, and water data are often only accessible in different providers’ portals and/or shared as CSV files. To add to the complexity, sometimes multiple energy retailers are used to serve different sites. Centralising and normalising all utilities data is a critical first step to better understand consumption and CO2 emissions across the board and determine where to target reduction.
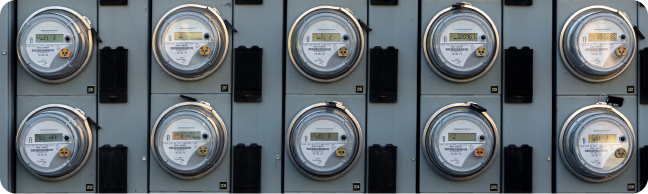
Also, too often, organisations analyse utilities data after the fact i.e. when the utility bill arrives. Instead, pro-actively monitoring buildings and facilities consumption using data from smart meters allow to act immediately when abnormal consumption is detected. For example, if your HVAC is still running at full capacity at night or during week-end you don’t want to wait until the invoice comes to realise that.
Our solution
Due to its exceptional flexibility Huwise is the ideal platform to centralise and normalise all your utilities, energy and other sources of Greenhouse Gas emissions data. This includes Water, Gas, Electricity, Fuel, Waste and any other source of emissions you would like to track.
Data can be ingested on a regular basis (e.g. monthly) when data is made available by your providers, but we can also ingest data from APIs and smart meters in real time for a more granular and pro-active monitoring.
We can also ingest data related to your emissions reduction initiatives such as Solar PV equipments, Electric Vehicle charging stations, Landfill Gas recapture etc., in order to track effort and progress towards net-zero.
Data can be kept private for internal usage, and a subset can be made publicly available to communicate to your community on your progress towards reducing your emissions.
How does it work in the background?
 Consumption data provided by the electricity, gas and water retailers is normalised in one single format.
- 15mn electricity consumption data points collected by smart meters and received in NEM 12 format is converted in a format that can easily be analysed (1).
 Near real-time data is retrieved from APIs, such as Solar PV or EV charging stations.
- Alerts are configured to detect abnormal consumption in near real-time from smart meters data.
 Reconciliation between consumption measured by smart meters vs. invoiced by retailers is performed.
- CO2 emissions scope 1, 2 and 3 are calculated following the GHG protocol methodology and using official emission factors.
- Results are represented in user friendly dashboards.
Note:
- (1) where smart meters are not already installed, we can install LPWAN sensors that count the number of pulses on analogical meters, and convert pulses into consumption